


Local-area networks (LANs) use digital data communication technologies to connect workstations and storage devices across multiple locations. LAN technology has progressed rapidly since its introduction in the 1980s, with new interfaces and techniques enabling systems to keep up with the growing use of multimedia and distributed applications in workgroups. This article from Agilent Technologies discusses some techniques and tools for testing LAN performance.
LAN testing provides information about the operational state of individual LAN components, as well as characteristics of the data packets being transmitted. The two testing methods discussed here are signal condition measurements, and protocol analysis and statistical measurements.
Signal condition measurements
Signal condition measurements involve using an oscilloscope to determine physical signal shapes. The signals can be measured either directly at a connector or on a coaxial or twisted-pair cable. For example, signals could be measured at transceivers, or at the interfaces of active network components, such as repeaters, bridges, or routers. Information about the quality of the cable infrastructure, media access unit, or interface under test can be determined from the signal shapes displayed on the oscilloscope. Signal condition measurements are not as significant in LANs as they are in WANs, however, because the signals only travel relatively short distances and deterioration is relatively minor. In troubleshooting however, and especially in diagnosing faulty interfaces in network nodes, repeaters, or bridges, or when dealing with problems in the cable infrastructure, signal condition measurements are very useful for narrowing down the range of possible causes.
Protocol analysis and statistical measurements
A protocol analyser records and interprets data packets transmitted over the network. This process makes it a useful tool for monitoring packet types and protocol processes, as well as for collecting statistical data and identifying trends. The protocol analyser is attached like any other network node to the LAN segment under test, as shown in Figure 1. In broadcast LAN topologies, such as 10/100/1000 Mbps Ethernet, 4/16 Mbps Token Ring and FDDI, the protocol analyser can then monitor and analyse all communication on the segment.
The protocol analyser can monitor only the segment in which it is installed. Traffic that is beyond a bridge or router cannot be tested because it is precisely the task of the router or bridge to limit local traffic to its segment of origin. To analyse traffic in two segments simultaneously - to observe inter-segment traffic as it crosses a particular router or bridge, for example - a protocol analysing system with two ports is required. It is not possible to monitor several segments at once with a single-port device, for the simple reason that the device cannot be connected in two places at one time. Network-wide monitoring is performed by a system of probes, usually with agents installed in all LAN segments. These agents collect pertinent data and time-stamp it, then transmit it using the simple network management protocol (SNMP) to a central network monitoring station, where it is correlated and analysed.
It is more difficult to perform network analyses in topologies based on the switching principle, such as switched LANs or ATM networks. Unlike Ethernet hub or ring concentrator ports, each port on a LAN or ATM switch transmits only those packets that are addressed to the connected segment or node. If a given LAN or ATM switch port is connected only to a single station, then each protocol analyser port can monitor only one connection.
To monitor all switch ports simultaneously, a multiport analyser system has been developed for use in switched-LAN environments. This system comes with 4, 8, 12 or more ports and can be used to monitor the corresponding number of switch ports. Alternatively, many switches offer the option of defining unused ports as test ports, and can be configured to copy data packets from the active ports to these designated test ports. This allows a single analyser port to monitor data from a number of active switch ports. When the switch is operating at peak loads, however, the capacity of individual test ports is not sufficient to monitor all, or even a few, ports reliably, since the test port usually has the same total capacity as any one of the ports being monitored. Data packets that exceed the test port capacity are discarded at random. Figure 2 shows connection options for a protocol analyser in a switched LAN.
LAN analysis system
The 'Agilent LAN Advisor' product suite makes it easier to get top performance, reliability, and uptime from mission-critical networks, Ethernet, 4/16 Token Ring, or FDDI networks. With the LAN Advisor, one can connect virtually anywhere in the network and capture the data needed to clearly understand what is going on and what is required to solve and prevent network problems.
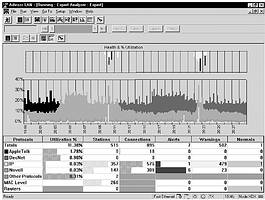
* Expert advisor: LAN Advisor is equipped with an Expert Advisor, a tool that gives an instantaneous view of the key issues and overall health of the network. Use and significant events can be seen graphically and by protocol. One can obtain further details when focusing on specific items of interest, like the client-server connection with a slow file transfer rate. As traffic is monitored, the LAN Advisor transforms data into meaningful diagnostic information, constantly monitoring the traffic on a network. The Expert Advisor (see Figure 3) reduces thousands of frames to a handful of significant events, including watching continuously for router misconfigurations, slow file transfers, inefficient window sizes, and connection resets. It can watch for all of these events in realtime and for each protocol stack - as the events occur.
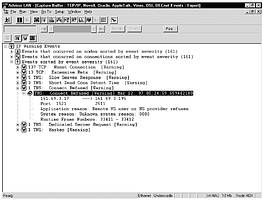
If more detail is needed than Expert Advisor provides, then the Protocol Commentators can log and link events, corresponding captured frames. The result is that one can easily scroll through the capture buffer to see the events that led up to the occurrence and view the details of the event itself.
Feature highlights of LAN Advisor
* Realtime data capture and display of network health: network health overview indicates when action is required; clearly indicates who is using the bandwidth and how it is being used; rapid identification and resolution of errors keeps the network up and running; network use by protocol shows overall network activity.
* Guided troubleshooting: continuous feedback on key network issues: problems identified by severity to prioritise troubleshooting; drill-down sequences enable fast fault isolation without extensive protocol knowledge; intuitive Windows 98 user interface enhances productivity; extensive on-line help explains problems and recommends solution.
* Information for understanding network issues: flexible filtering for selecting only the required data; connection analysis to understand traffic patterns; statistics exportable to the Internet Reporter for long-term trend analysis.
* Database analysis and optimisation for Sybase and Oracle: identifies problems accessing the database; helps tune performance by showing response and transmission times; identifies security violations.
* Performance measurements: Expert Advisor - graphs utilisation and health over time, provides summary information on connections, protocols, and network events of interest; Commentator - detailed list of network events on connections and on nodes; Protocol statistics - detailed view of the active protocols on the network, including utilisation statistics, number of errors and average frame size.
* Advanced traffic generation and packet editing functionality: active stimulus/response tests to troubleshoot a production network; test new equipment or configurations before deploying them in the network.
* Advisor reporter: extends the capabilities of LAN Advisor into the world of baselining and benchmarking; uses information gathered to produce high quality, professional reports.
| Tel: | +27 12 678 9200 |
| Email: | [email protected] |
| www: | www.concilium.co.za |
| Articles: | More information and articles about Concilium Technologies |


© Technews Publishing (Pty) Ltd | All Rights Reserved
 printer friendly version