


Terrestrial solar inverter designers and manufacturers must ensure their products are capable of extracting and delivering the maximum power that is available from the solar modules to which they are attached. Power available from a solar module is highly dependent on its illumination and temperature.
The maximum available power is known as the maximum power point (MPP), and it changes with operating conditions.
For inverter design, development and qualification, it is critical to test with an array of MPPs. To obtain a full range of MPPs and other operating points from a solar module with which to test an inverter, it must be exposed to a predictable, repeatable and broad range of illumination and temperature conditions for extended periods. That is impractical to do in a test environment with a solar module.
The E4360 solar array simulator from Keysight Technologies is designed to simulate controllable, consistent, stable and wide ranging solar module performance. It allows the user to controllably and consistently reproduce I-V curves with which to test an inverter. Three curve generation methods are provided: SAS mode, table mode, and a built-in offset feature.
SAS mode
When providing the E4360A with a module’s open circuit voltage (Voc), short circuit current (Isc), and its voltage and current (Vmp, Imp) at the maximum power point, the simulator’s internal firmware algorithm uses the equations of an exponential solar cell model shown in Figure 1 to establish an I-V curve with either 4096 or 256 current and voltage data pairs.
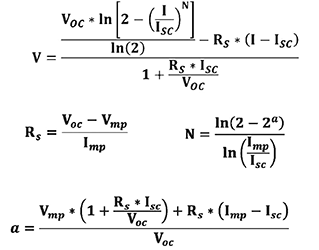
Table mode
The E4360 can be provided with up to 4000 current and voltage data pairs to precisely model the curve to simulate. This method is useful when the simulator’s internal algorithm does not provide sufficient correlation with the module that must be simulated, or when the I-V curve is complex. Multiple solar modules connected in parallel, for example, may give rise to the possibility of curves with multiple maximum peak power points that cannot be reproduced with the internal algorithm.
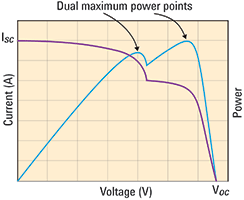
The complex curves in Figure 2 represent an application-specific implementation representing modules in parallel, isolated by diodes, and with a part of one of the modules in shadow.
The user can enter from 3 to 4000 current and voltage (I-V) pairs in table mode.
Regardless of the number of data pairs entered, the E4360 will generate either a 256- or 4096-pair table through linear interpolation, depending on which resolution is selected. Every I-V pair must consist of a current and a voltage value (refer to Table 1).

The maximum analog current resolution is based on the full-scale rating of the solar array simulator module model chosen. If values are not provided for the open circuit voltage and the short circuit current, the simulator will interpolate with the given data to generate Voc and Isc.

The E4360 will accept entries for maximum power point currents (Imp) equal to the short circuit currents provided. Entries for maximum power point voltages (Vmp) must be less than the open circuit voltages (Voc) entered. The data must be monotonic, must fall above a straight line drawn from Isc to Voc, and the slope (converted to and expressed as V/I ) everywhere on the resulting curve must meet minimum requirements – see Figure 3. The simulator checks for monotonicity along the entire curve and the slope of the curve as it terminates at Voc.
Offset feature
An I-V curve that the E4360 generates with the entry of current and voltage pairs (table mode) can be adjusted without modifying its basic shape. If the module being simulated will generate I-V curves that will retain a basic shape with changing conditions, that shape can be used as a template. Offset values are applied to each of the original I-V data pairs entered prior to the generation of an internal table through interpolation.
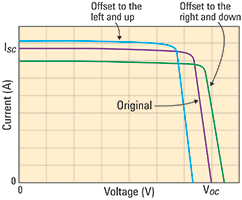
Programmatically adding or subtracting offsets in voltage and/or current can effectively simulate changing illumination and temperature levels without the need to enter additional curve data. Refer to Figure 4.
List feature
In addition to the three curve generation methods above, the E4360A list feature offers the capability of queuing separate curves in each of up to 512 list steps. The user can enter a separate dwell time for each step or execute a trigger to move from step to step. They can also trigger a list to begin and repeat from 1 to 256 times or run continuously.
Ensuring inverter performance
Using the capabilities of the E4360 outlined above, the necessary tasks to ensure inverter performance can be performed.
Developing and verifying performance of inverter peak power tracking circuits and algorithms
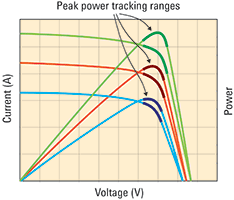
When the objective is to develop an inverter that will extract as much of the available solar module power under all environmental conditions as possible, maximum peak power tracking techniques will generally be employed. In the design and development of circuits, the peak power tracking range, as depicted in Figure 5, must be considered, as well as the tracking frequency.
The peak power tracking range is the distance on the I-V curve on either side of the maximum peak power point that will be traversed by the action of the inverter’s peak power tracking circuitry and algorithm, and the tracking frequency is the rate with which the tracking range is traversed.
The tracking range must be broad enough and the tracking frequency high enough to ensure that the inverter is always capable of finding the maximum peak power point as the module I-V curve undergoes changes. To verify that the design is valid, the tests to confirm the performance of the inverter must be based on accurate, reproducible I-V curves.
It is important to understand and take into consideration the boundaries of solar array simulator performance. The ability of a solar array simulator to reproduce the programmed I-V curve as the inverter maximum peak power tracking circuitry and algorithm change the operating point is partially a function of the power tracking range and the tracking frequency. Broader power tracking ranges and higher tracking frequencies will introduce greater simulation error than narrower ranges and lower frequencies.
To ensure that measurements are valid, a baseline can be established using an electronic load such as the Keysight N3300 to find the maximum power point of the programmed I-V curve to which the power extracted by the inverter can be compared.
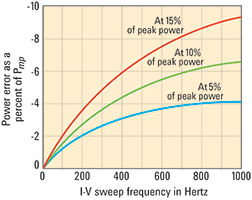
The power error as a percentage of the power at the maximum power point (Pmp) with tracking frequency and power tracking range is depicted in Figure 6. The power tracking range indicated on the figure is expressed as a percentage of peak power and traverses both sides of Pmp. In this example the load on the simulator is sinusoidally swept from -5%, -10% or -15% on one side of Pmp to -5%, -10%, -15% on the other side of Pmp.
Measure and verify inverter efficiency
In addition to extracting as much of the available module power as possible, the inverter must efficiently convert the incoming DC power to AC power. Applying a range of fixed DC voltages to the input of an inverter may provide some meaningful results, but it does not fully exercise the maximum peak power tracking (MPPT) circuitry and its interaction with the DC-to-AC conversion function.
Conversion efficiency can depend on the interaction of the MPPT and DC-to-AC conversion circuitry, and it can depend on the DC operating voltage levels in the power path. The greater the frequency and range of the maximum peak power tracking function, the more likely that the application of a range of I-V curves, rather than a range of fixed DC operating points, will yield precise inverter efficiency data.
Verify the ability of the inverter to produce power grid level output at high and low input voltage extremes
If the inverter must produce power grid level output with low and high voltage and power input extremes to take advantage of available solar module power at dawn and noon, for example, it should be ensured that the inverter will function correctly with the I-V curves produced by a module under those conditions.
Using a solar array simulator allows the user to change curves gradually or rapidly from one extreme to another, and will help to determine if rates of change and extreme curves have a significant influence on the operation of the inverter. Consequently, if operation with such curves or the rate of change of curves has an undesirable outcome, the simulator can aid in isolating performance issues, or conversely, operation per expectations can be verified.
With the E4360, curves can be changed as quickly as 30 milliseconds. Much of that time is spent in preparation for the change – the actual transition from one curve to another occurs in less than 15 microseconds.
Perform qualification tests – confirm inverter performance during or after exposure to environmental conditions
The qualification process typically involves verifying performance to specifications under an array of environmental conditions. An inverter may be exposed to shock, vibration, transportation, temperature, humidity, altitude, etc, and to an array of electrical tests. Some of the tests will be performed in an environmental chamber, and for some of the tests, the inverter will be in operation.
To ensure that an inverter is fully capable of performing to specifications over the entire range of input and environmental conditions, a full range of I-V curves will typically be tested. Where necessary, the changing of I-V curves can be synchronised with the test being performed. With the E4360A solar array simulator, the I-V curves can be tailored to meet the requirements of the test, and with its built in simultaneous voltage and current measurement capability and datalogger, voltage and current readings can be captured throughout the test procedure.
In many cases, the accuracy of Watts calculable from voltage and current readings is sufficient. An electronic load such as the Keysight N3300, a power grid simulator on which the voltage and frequency can be adjusted, and the Keysight E4360 solar array simulator form an ideal addition to environmental test equipment for inverter qualification. When required to measure current, voltage and power with greater precision, a Keysight DMM and a precision wattmeter can be added.
Perform accelerated lifecycle tests that introduce the effects of years of operation in just weeks
The E4360A facilitates the performance of accelerated life testing. As the inverter is tested with chamber-based environmental conditions meant to simulate 24 hours per day, 365 days per year real-world exposure, changes in solar module output with changes in temperature and incoming solar radiation should be simulated. It may also be required to simulate many other conditions that change module output, such as partial shadow, age, accumulation of dust and dirt, wind velocity, etc.
To accelerate lifecycle tests the rate of change of environmental conditions and module output must be increased dramatically to achieve results in just weeks rather than years. With the E4360, I-V curves can be generated and synchronised that correspond to changing environmental conditions to which the inverter is exposed. I-V curve changes can be triggered by external events via the digital I/O ports or programmatically.
Perform certification tests
Certification tests may be required to participate in various renewable energy programmes sponsored by governments and private entities. For example, the California Energy Commission (CEC) maintains a list of inverters and other types of equipment that are eligible for participation in state-sponsored programmes.
To qualify for inclusion on the eligibility list, inverters must conform to specific requirements and pass a series of tests. Inverter requirements and test procedures, as well as the basic requirements of a solar array simulator, are available on the CEC website. The E4362 solar array simulator provides the range of output, analog performance, stability and accuracy to ensure valid, repeatable test results.
| Tel: | +27 12 678 9200 |
| Email: | [email protected] |
| www: | www.concilium.co.za |
| Articles: | More information and articles about Concilium Technologies |


© Technews Publishing (Pty) Ltd | All Rights Reserved
 printer friendly version