
Energy savings are top of facilities owners’ agendas, and HVAC systems tend to be the largest contributor to the energy bill. Tax rebates are often based on energy savings per square metre, but savings on HVAC energy costs can cause significant indoor air quality (IAQ) issues due to improper ventilation, temperature and humidity control.
Leaving the system off until occupants arrive in the morning might save money, but allows pollutants to build up in the air. If an HVAC system is not properly maintained and the air filter checked, it could lead to IAQ problems. The effects of IAQ have been highlighted in numerous environmental risk reports and joint agency efforts by the US Environmental Protection Agency (EPA). Further studies indicate that indoor air in some commercial buildings is up to five times more polluted than outdoor air.
Airborne particulates come in a variety of forms ranging from animal dander, plant pollen and airborne bacteria, to fibre-glass, asbestos and combustion particles that are generated from part of the production equipment or process. To properly identify and troubleshoot IAQ problems, the technician needs a tool that not only reads particle concentrations for spot check, but also provides continuous monitoring for process control.
Why particle counts matter
Different locations have varying levels of acceptable particulate concentrations. In a residential and commercial environment (i.e. homes, offices, hotels), health and comfort concerns and fear of litigation often drive IAQ investigations.
In industrial and institutional environment (hospitals, food and beverage plant, electronic and precision manufacturing), energy cost, contamination control and production yields are the primary concern. Excessive levels can result in medical conditions such as Sick Building Syndrome, lower productivity, contaminated product or all of the above.
Maintaining acceptable air quality levels not only lowers the costs associated with downtime, but also reduces or removes costs associated with expensive fixes in the future. The first step in establishing an IAQ maintenance programme is to determine if a problem currently exists.
IAQ investigation
An IAQ investigation is the first step in an ongoing maintenance programme or in responding to complaints potentially associated with air quality. No matter if it is a commercial/residential or industrial/institutional environment, the methodology is similar:
1. Conduct a survey of credible staff at the facility. Who has filed complaints, and what are the symptoms? Are those who complained centrally located, or dispersed throughout the facility? The purpose is to gauge the level of toxicity or concentration as evidenced by allergic reactions or irritation in human comfort or increased contamination in product.
2. Research the building’s history. When was the building built and/or remodelled? Have there been any instances of excessive damage, and how were the repairs carried out? What are the maintenance practices within the facility? For example, roof or plumbing leaks may have been repaired, but the underlying water damage may not have been addressed.
3. Perform a physical inspection. Technicians need to be aware of their test environments by considering harmful particulate sources. Within a given location, areas containing exhaust vents, furnaces, cleaning supplies, as well as areas with fresh paint and/or carpeting must be accounted for, especially if present within a complaint area. Are there any odours or visible sources (i.e. mould)?
4. Take air quality measurements. When conducting a complete IAQ investigation, temperature, humidity, CO and CO2 readings should also be taken to identify problems related to inadequate and/or contaminated ventilation, potentially creating a particulate problem.
For example, temperature and humidity readings play a key role in identifying mould and bacteria. A location with high relative humidity and higher concentrations of particles 3,0 μm or larger may indicate the presence of mould spores, which should be remedied once identified. High concentration of 0,3 μm to 10 μm particles may imply the presence of bacteria which may endanger patients in a surgery room or special infirmary.
The most efficient procedure for assessing indoor air quality is to obtain several outdoor air readings as baselines, noting where the readings are taken in relation to the facility. At least one of the readings should be from near the building’s fresh air intake vent.
Note, however, the location of the intake vent to ensure baseline readings are not skewed by pollutant sources, for example, locations near a loading dock. An indoor air particulate ‘target’ is then calculated by modifying the baseline readings by the efficiency of indoor filtering.
In the case of cleanroom applications, ‘as built’, ‘at rest’ or ‘operational’ (the three cleanroom stages) can be used as baseline. But once the baseline is established, data collected should always be compared against the same baseline.
Particles tend to diffuse very quickly into the surrounding air, making source identification a challenging task. One method is to take multiple indoor readings, starting with the complaint area first, then move outwards. Get a map of the HVAC systems, as installed and use that to create an inspection route. Within each zone, take a measurement in the middle of the space as well as near the air intakes, outtakes and any other HVAC system elements.
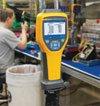
Make particular note to measure both upstream and downstream at any HEPA filters. As data is collected, take note of any unusual increases in particulate quantity and size. One can make use of the Fluke 985 location naming and data storage capability to distinguish particle concentration in different locations for comparison.
Compare the particle readings against the baseline to get a feel for the relative severity of the particulate concentration, and identify hotspots and pathways that may lead to the particulate source. Continue to follow the path of higher concentrations until the source is identified. Once the sourceis remedied, the area is reassessed to ensure the corrective action addressed the problem.
Combined with the Fluke 971 temperature and humidity meter, the technician can also gauge the temperature and humidity readings against the accepted parameters (see ASHRAE Standards 55 and 62) for a basic IAQ investigation, and take appropriate steps to treat the problem.

Interpreting the data
A correct interpretation of the data requires an understanding of the test area. Is the area residential or commercial? Is it a cleanroom or precision manufacturing area? Is the cleanroom at rest or operational? Is the location exposed to tobacco smoke or combustible particles? Is there construction at or near the location? A proper assessment of the environment can help narrow down the list of problem particulates.
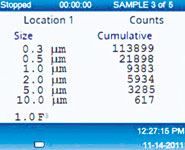
Concentration limits vary widely according to the size and type of facility, among other variables. However, a high-level assessment can provide direction on whether or not a problem exists. The outside air readings in Figure 1 provide a high-level point of reference for the technician.

Scenario 1: The particulate levels displayed in Figure 2 are from a new residence (<5 years), and do not indicate any concentrations outside of the norm. In a residential setting, particle levels are sometimes higher than outside readings due to more potential particle sources (i.e. pet dander), smaller diffusion area, and often less sophisticated filtration.

Scenario 2: The particulate levels displayed in Figure 3 are representative of an average office workspace, and do not indicate any concentrations outside of the norm. In a commercial setting, particle levels should be significantly less than outside readings due to better filtration and better dilution with outside air.

Scenario 3: The particulate levels in Figure 4 are from an older residential location with visible mould. The readings are significantly higher, and steps should be taken to remedy the mould and address the root cause of the problem.

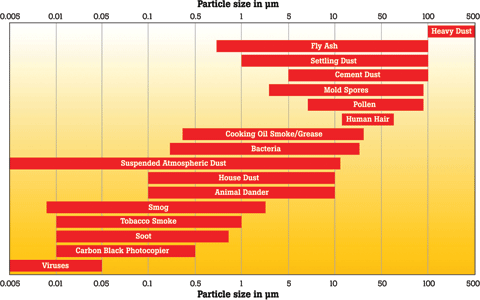
Scenario 4: If the particle source in Scenario 3 is not visible, use particle size tables such as Figure 5 to identify possible sources. Obtain a sample of the particles and submit to a lab for further analysis.

A cleanroom exercise (certification and monitoring)
Cleanrooms are an excellent application for a particle counter. Certification for cleanrooms is usually conducted at ‘as built’ stage. For illustration purposes, let us put the Fluke 985 to the test in evaluating an ISO Class 5 (per ISO 14644) cleanroom. To qualify as a Class 5 cleanroom, levels cannot exceed the limits for the class in each particle size stated in Table 1.

Our test is concerned with the concentration of 0,3 μm particulates in the room. Several 2 litre samples are taken from six different locations over six different times inside the cleanroom, with the results as shown in Table 2.

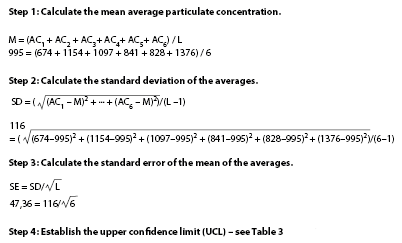
The individual readings are well within the limitations for the cleanroom; however, we can take the following steps to determine the statistical validity of the readings:


The resulting mean count for all locations is within the requirements of a Class 5 cleanroom.
The Fluke 985 provides particulate data over six channels on a single display, allowing the technician to view all readings at a glance. Though the cleanroom exercise focused on 0,3 μm particulates, the single display would immediately alert the technician to anomalies in other particle size concentrations.
With the Fluke 985, the technician can configure the number of channels displayed for different particle sizes and also set an alarm alert via audio or highlighted text for count over-concentration for the particular particle size of concern.
Once the cleanroom is certified, the technician can also use the trend graph function of the instrument to monitor particle concentration over specific time periods they can define. This can be used at the operational stage of the cleanroom. This allows the technician to monitor the manufacturing process if there is any unusual spike of particle concentration and track down the event that introduces contaminates to the process.
This also allows the technician to view the trend immediately on the unit before data is exported, saving time on data download. With the Fluke 985 USB/Ethernet cradle, the technician can quickly transfer the data to computer via USB or over the network for immediate data analysis so that corrective actions can be quickly deployed.
The delay function of the Fluke 985 is useful for determining ‘at rest’ cleanroom particle concentrations after facility occupants have exited the cleanroom and the room’s ventilation system has filtered the air and the environment has stabilised.
Particle counting in perspective
The key to a successful IAQ investigation is to be aware of the environment as a whole. Location, building history, complaints, process records, and measurable factors such as temperature and humidity, pressure and particle concentration all play a role in uncovering IAQ problems.
When using a particle counter, be aware that a particle’s source may only be a symptom of a much larger issue looming under the surface. Remediation of the source may not address core problems of poor filtration, ventilation or excessive moisture. Left unchecked, these conditions will cause the same symptoms, or worse, to reoccur with certainty.
Particle counting as part of ongoing preventive maintenance is critical to ensure a healthy environment and good production yield. The Fluke 985 is a powerful, rugged, and easy to use tool to assist the technician in identifying particulate problems and authenticating the efforts to address their root causes.
Making sense of particle counter features
Using a particle counter is relatively simple; however, understanding the features that distinguish counters can sometimes be a challenge. The following terms are commonly used to describe the accuracy, efficiency and other attributes of an airborne particle counter.
Count mode: The count mode defines how the particle counter displays data to the user. Concentration and raw count are two typical sampling modes, and the Fluke 985 adds an audio mode. Concentration mode samples a small volume of air then calculates the value based upon the volume setting (cm³, ft³ or litre) in the counter while raw count mode allows the user to collect actual particle counts as they accumulate per sample time.
It can be set to cumulative (the total number of particles > each channel size) or differential (the number of particles fall between the channel sizes). Audio mode is useful when searching for areas that exceed predefined particle levels. Once exceeded, the counter notifies the user in audio alarm. The count mode defines how the particle counter displays data to the user.
Zero count: Zero count is a measure of the particle counter’s accuracy, and should be taken prior to use and periodically thereafter, or when sampling error is suspected. The zero count filter is attached to the particle counter per the manufacturer’s instructions, then the counter is run for 15 minutes. The counter should not have detected more than one particle greater than 0,3 μm in a five-minute period.
Coincidence loss: Coincidence loss occurs when two particles cross the counter’s light beam simultaneously, creating a single pulse and resulting in a single particle count. This type of error occurs more frequently as the concentration of particles increases within the sample. Per 21501-4, coincidence loss must be ≤10% by the maximum particle number concentration. Fluke 985 is 10% at 4 000 000 particles per ft³.
Counting efficiency: The probability that the counter will sense and count a particle passing through the sample volume. Counting efficiency is a function of size up to a minimum sensitivity threshold, above which all particles are sensed and counted. A counting efficiency of 50% at the most sensitive threshold is typically considered optimal, and facilitates consistent comparisons between counts from OPCs and those of higher-resolution instruments.
Sensitivity: A device’s ability to detect small particle sizes at a certain counting efficiency. The Fluke 985 detects 0,3 μm at 50% counting efficiency.
Calibration: A set of operations or actions taken to establish the relationship between the measured values obtained through a device and the values of the corresponding parameters as defined in a standard. The Fluke 985 is calibrated using PSL (polystyrene latex) spheres, widely used due to their uniform size and light-refraction properties and meets ISO 21501-4: Light scattering airborne particle counter for clean spaces.
NIST traceable: Traceability is a characteristic of a measurement or standard and its relationship to stated references, which are often national or international standards. The PSL spheres used in the Fluke 985 calibration process can be traced to NIST (US National Institute of Standards and Technology) standards.
For more information contact Comtest, +27 (0)11 608 8520, [email protected], www.comtest.co.za
| Tel: | +27 10 595 1821 |
| Email: | [email protected] |
| www: | www.comtest.co.za |
| Articles: | More information and articles about Comtest |

© Technews Publishing (Pty) Ltd | All Rights Reserved