


Over the past 30 years, the MCU market has evolved into a $10 bn worldwide market across an incredibly broad range of applications. Despite the maturity of this market, vendors continue to develop innovative solutions based upon 8-bit processors. The 8-bit 8051 architecture was first introduced in the 1980s and has since attracted a large and loyal user base.
Over the years, innovations have resulted in additional features such as field programmable program memory, integrated analog-to-digital converters and enhanced serial communication. The latest generation of 8051 MCUs is breathing new life into established architectures by increasing performance, integration and flexibility. These devices have truly become system-on-a-chip (SoC) products.
With the advanced integration of these devices, a new set of challenges arises for the embedded software development and debug process. For complex systems, source-level software development and debug tools are essential. However, the key to embedded systems debugging is the link between the source view and the hardware. Although traditional embedded development techniques have been adequate for relatively low-throughput controllers with little or no analog functionality, these methods are insufficient for the latest SoC products.
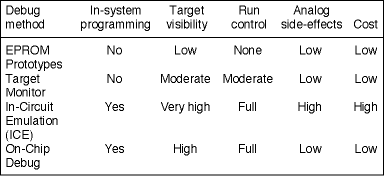
In the 8-bit world, embedded systems developers have usually relied on three basic strategies for debugging: EPROM/OTP prototyping, a target monitor program or an in-circuit emulator (ICE) system. Yet for advanced, mixed-signal MCUs, an on-chip debugging system has the greatest advantage. The following examines each of these methods and their suitability for the latest generation of complex embedded systems.
EPROM/OTP prototyping
Historically, the most basic development method for embedded projects has been EPROM/OTP prototyping. In this scheme, the developer creates the software in assembler or C language on a desktop PC and then programs EPROM, OTP or EEPROM devices with the object code. The target device is mounted on a prototype board with a device socket for debugging. The developer then tests the system to determine if the functionality is correct. Errors can then be corrected by modifying the source code, programming a new device and mounting the new device in the socket to repeat the testing process.
In the past, this approach to software development has been a very low cost and effective method for software development. However, this process quickly becomes unproductive for advanced mixed-signal devices. As the level of integration increases, vendors incorporate more program memory, data memory and processor performance in the controller, allowing for more complex programs. However, the prototype device offers little or no visibility into the inner workings of the system. The developer must include software hooks (such as toggling external pins) in order to monitor code execution and target behaviour. The code-program-test cycle can be lengthy and quickly becomes very tedious.
Another difficult factor in this type of development tool is the chip packaging. As the end system becomes more complex, the developer is forced to pack more circuitry in a smaller form factor. Depending on the system space requirements, sockets may not be practical. In an effort to address system space constraints, chip vendors offer high pin-count, surface-mount packaging. However, these devices are difficult to mount or re-work on a PCB by hand, making the EPROM prototype approach impractical.
Monitor code
To address the visibility shortcomings of the EPROM/OTP prototype approach, the next step is usually to include a software monitor program in the target device. The target monitor communicates with a PC-based debugger via a serial link and allows basic in-system run control of the target such as run/stop, single-step and software breakpoints. Breakpoints are implemented by replacing instructions in the target device's program memory with a jump to the monitor program.
Overall, this approach offers an improvement in debugging capability since the developer can query the target device in the end system while running. However, this scheme consumes user resources in the target system to implement the serial link and command interface. Also, ROM-based code cannot be debugged with this method since the monitor must alter program memory to provide run control. Since the monitor is generally an interrupt-driven software process in the target system, the user cannot set breakpoints within interrupt service routines. Interrupt routines can be a significant portion of the total program in complex embedded systems, so the inability to debug within interrupts is a serious drawback.
ICE systems
The top end of 8-bit development systems is the in-circuit emulator or ICE. An ICE consists of an emulator pod that includes circuitry to exactly reproduce the behaviour of the target device. The pod replaces the controller in the target system electrically via a cable/socket combination.
The main advantage of an ICE system is that it provides complete visibility of the inner workings of the target device. The developer can see precisely what the code is doing as it executes. Basic ICE systems provide emulation RAM for the target code and complex hardware breakpoint capabilities. Most ICE systems also include realtime trace capability, allowing pin states and internal variables to be captured for hundreds or even thousands of clock cycles. This capability is extremely useful for debugging complex realtime problems. ICE systems are non-intrusive from a software point of view since the emulator acts exactly as the true target will.
Of course, all this functionality comes at a price. Full-featured ICE systems can cost as much as $25 000 - even for 8-bit systems. Also, as clock speeds increase, it becomes more difficult to specify the system such that an ICE can be used, since the cables and mechanical connections introduce extra signal delay. Particularly for advanced analog systems, the emulator cables become a serious consideration. Cable inductance, parasitic coupling and interference conspire to make emulation of precision analog circuits virtually impossible (Figure 1). As a result, developers of mixed-signal systems can only use an ICE for debugging the digital behaviour and must wait until later in the design cycle to determine the true analog performance.

A better solution: On-chip debug
Ideally, an embedded development and debug system should provide a simple programming method, internal visibility of the target system and realtime control - all at a reasonable cost. The combination of in-system programmable Flash memory and a small amount of on-chip dedicated debug logic provides just such a development environment.
The first element of an effective on-chip debug system is the use of in-system programmable Flash for code memory. In-system programming provides many advantages, both during and after development. The ease and speed of programming accelerates the design cycle since program modifications can be made quickly and easily without modifying the hardware. This reduces the amount of development time required and lowers costs. Also, Flash-based devices reduce design risk by allowing developers to make revisions late in the design cycle, and reduce maintenance costs by allowing remote or on-site field upgrades.
Combining in-system programmability with integrated logic to support debugging creates a powerful, low-cost development system. An on-chip debug system includes a dedicated serial link to communicate with PC-based software to provide both a debug and programming interface to the target device. This hardware/software combination provides a complete embedded software development solution.
The advantages of the on-chip debug method are numerous. None of the system's user resources are required since the programmer/debugger has its own dedicated interface, and the on-chip debug logic provides realtime run control in hardware. This technique is non-intrusive, since the actual user code is debugged without modification in realtime in the target system. Development and debug can be done using production devices in the user's target hardware. This debug environment is more affordable than an ICE system.
On-chip debug is especially useful for precision analog systems. Development using production devices becomes a key benefit, since the developer can evaluate the true analog performance of the complete system, including board layout and parasitic effects. Without an emulator pod, there are no additional cables, sockets or probes to interfere with the analog performance. This enables true debug of analog subsystems in realtime.
This type of on-chip debug system is common in the 32-bit MCU space, but most 8-bit architectures have not adopted these techniques. However, for more advanced mixed-signal SoC devices, on-chip debug is essential.
Silicon Laboratories' C8051 family
Silicon Laboratories' C8051F products are based on the 8051 instruction set architecture but is a completely new, proprietary implementation that provides a 20 to 25X performance improvement over the original 8051. The C8051F devices combine a high-performance 8051-compatible processor core, precision analog peripherals and in-system programmable Flash memory to create a diverse product line of advanced SoC solutions. The company's newest product family, the C8051F064, offers a 25 MIPS 8051 CPU with dual 1 million sample per second (1 Msps) 16-bit successive approximation ADCs and up to 64 KB of in-system programmable Flash memory.
All of the company's MCUs come with a complete development kit that provides features typical of in-circuit emulators. The C8051F on-chip debug logic uses a JTAG-based dedicated serial debug interface and supports up to four simultaneous hardware breakpoints. Using a PC-hosted debugger, the user can inspect/modify memory locations, set/clear breakpoints, single-step and modify Flash. Silicon Laboratories' integrated development environment (IDE) software supports source level debug in assembler or C language and third party compiler integration. All debug and development is performed on production devices in the user's target hardware; no emulator hardware is required. The debug logic insures that the peripherals remain lock-stepped with the source view during debug events (such as single-stepping) and also allows debugging of interrupt service routines (Figure 2).
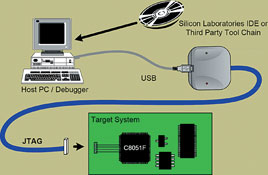
The on-chip debug and development system uses a PC-hosted debugger which communicates with the target device debug logic via a dedicated serial link. A simple serial adapter converts between USB and JTAG formats. Silicon Laboratories' development system increases ease of use and preserves the performance of precision analog peripherals.
So what is next?
The current generation of advanced mixed-signal controllers with on-chip debug/development support offers an excellent tradeoff of benefits versus costs. However, it should be safe to assume that the capabilities of these on-chip debug systems will improve over time. Using 32-bit controllers as a guide, some of the more advanced features of those on-chip debug systems will soon migrate to the 8-bit world. Ideally, a solid development system will provide most of the features of an ICE system at a fraction of the cost. The key element missing from this generation of on-chip debug hardware for 8-bit systems is realtime trace capability. Look for vendors to offer increasing levels of trace functionality in the future, starting with realtime program trace features. More hardware breakpoints, complex breakpoints and conditional data breakpoints are also likely to be offered in the short term.
As vendors offer higher throughput cores, more analog functionality and more on-chip memory, additional debug support becomes essential. As system developers face shorter schedules and tighter budgets for more complex designs, they need controller vendors to provide systems that are simple to use, cost effective and easy to debug.
| Tel: | +27 11 608 0144 |
| Email: | [email protected] |
| www: | www.nuvisionelec.com |
| Articles: | More information and articles about NuVision Electronics |


© Technews Publishing (Pty) Ltd | All Rights Reserved
 printer friendly version