An engineer working in the field conducts routine maintenance on and troubleshoots deployed radio frequency (RF), microwave, and millimetre-wave systems. On any given day a variety of devices or signals may need to be measured including cables, antennas, over-the-air signals, or intermittent spurious signals, to ensure robust signal quality and uninterrupted service.
Successfully performing these functions requires a basic understanding of measurements and a portable, easy-to-use handheld instrument. This whitepaper outlines four common measurements that can be performed in the field: real-time spectrum analysis (RTSA), noise figure, over-the-air (OTA) testing, and a cable and antenna test (CAT).

Real-time spectrum analysis
RTSA processes signal samples gap-free and generates measurements, such as scalar, power, or magnitude, that correspond to traditional spectrum analysis measurements.
Signal interference over wireless networks is on the rise, resulting in poor signal quality that leads to dropped calls or choppy audio. It has a profound impact on wireless devices and communications, ranging from car radios to mission-critical applications such as public safety.
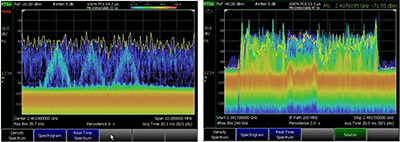
Traditional spectrum analysis techniques contain dead time wherein the analyser processes the data for display. Intermittent interference signals may occur during such dead time. Additionally, in a highly dynamic signal environment, wider or longer-duration signals mask weak signals and cause interference. Gapless RTSA, on the other hand, detects and reveals these transient, overlapping signals so that you can visualise the interferer.
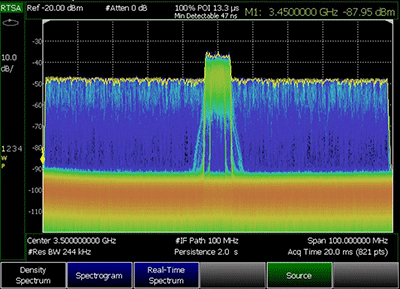
Co-channel interference detection and troubleshooting is the most challenging task in a communications network because interferers can hide under the serving frequency. Typically, a user has to turn off the carrier transmitter to find any other signals that appear in the same frequency channel before eliminating or reducing their impact. Turning off the carrier signal tends to be intrusive and can disrupt normal communication services. Furthermore, under many circumstances, turning off serving transmitters is not a viable solution, depending on the nature of the services, such as base station testing. Fortunately, RTSA profiles over-the-air characteristics, detecting hidden interferers under the serving carrier.
FieldFox handheld analysers with RTSA capture quickly-changing digital and pulsed signals as narrow as 5,52 μs with a 100% probability of intercept and full amplitude accuracy. With up to 100 MHz bandwidth, FieldFox’s RTSA mode can verify 5G and other wideband signal types. Using RTSA can verify signal integrity or identify unwanted signals that are undetectable with traditional spectrum analysers.

Noise figure
Noise figure measures the degradation of the signal-to-noise ratio (SNR) as a signal passes through an active or passive device. Noise figure uniquely characterises entire systems in addition to their components, including preamplifiers, mixers, and intermediate frequency amplifiers. By controlling the noise figure and gain of the components, the designer controls the noise figure of the overall system. Once the noise figure is identified, system sensitivity can be easily estimated from the system’s bandwidth.
One key performance indicator for a receiver is its sensitivity, which is the ability to reliably discern small signals close to the noise floor. A communication system’s performance relies on its SNR. Lower noise figure values typically mean better device performance. Internally generated noise, however, can hinder a device’s performance. Internally generated noise reduces the link budget, increases investment by the transmitter, and increases the antenna cost at the receiver. To obtain a complete picture of system performance, you need an additional evaluation of internally generated noise. Decreasing receiver noise is the most cost-effective way to optimise communication systems without reducing quality.
Combining noise figure measurements with FieldFox’s two-port vector network analyser, spectrum analyser, and power sensor capabilities enables you to completely characterise amplifiers and converters in the field. FieldFox analysers make noise figure measurements in the field simple with touch-of-a-button measurements. This feature includes the most common method of measuring system noise, the “Y-factor” method. This technique allows the measurement of system components such as amplifiers, downconverters, and upconverters. The change in uncertainty in real time may be easily viewed with the built-in uncertainty calculator, which displays vertical bars over the trace data. Being able to make these measurements quickly to characterise noise figure is important to optimise designs in the most cost-effective manner.
Cable and antenna test
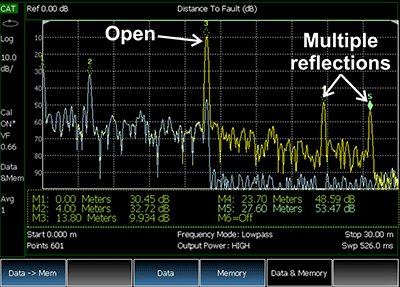
Faulty cables, connectors, and antennas cause many cellular base station problems. The failure of these components in cellular systems causes several issues, including poor coverage and unnecessary handovers. Cable and antenna measurements verify and troubleshoot RF/microwave transmission systems and antennas. These measurements occur along the coaxial cable that connects a transmitter to its antenna, or between an antenna and its receiver. CAT identifies the location of poor performance in adapters and damaged antennas, as well as breaks or bends in cable lines.
Harsh weather conditions frequently cause maintenance issues and failures in exposed cable system transmission lines. Sheltered cable installations also subject components to heat, stress, and oils that leak into the system. Additionally, cable faults commonly occur at interfaces between cables and connects where soldered joints and crimps in the cable weaken and break.
Transmission lines are often long, and sometimes kinks or cuts form in a line, making end-to-end cable measurements nearly impossible. There are two cable troubleshooting techniques that may be attempted:
• Distance to fault (DTF) reports the location of each cable fault.
• Time-domain reflectometry characterises the type of fault, such as a bend in the cable, or cut. A bend in the cable will appear capacitive whereas a cut in the cable appears inductive.

FieldFox quickly and accurately characterises an entire cable transmission system, as well as the individual components in the system. With DTF and TDR measurement capabilities available at the touch of a button, the location and type of damage in the cable line can be quickly pinpointed. The performance of a single antenna at the installation site with its signal reflection, return loss, and voltage standing wave ratio functions can also be verified. When there are multiple antennas at one site, FieldFox is also able to verify the antenna-to-antenna isolation, whether the antennas are associated with the same system or different systems.
Over-the-air testing
Wireless networks continue to grow increasingly complex, especially with new technologies such as 5G. Because today’s wireless networks consist of layers of macrocells, microcells, and picocells, network coverage is a significant challenge. With users shifting between LTE and 5G, operators face difficulties in defining and troubleshooting wireless coverage. OTA measurements assess the level of cell coverage needed to ensure continuous connectivity in various mobile communication scenarios, including voice, text messages, and data services.
OTA antenna testing in the field is the best way to verify that each cell has sufficient neighbours for successful handovers. With OTA measurements, you can scan an area to determine how many cells are available, identify which cells are good neighbours, and troubleshoot handover problems, such as missing neighbours.
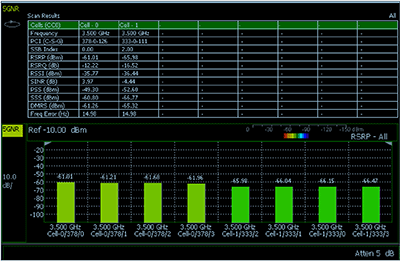
FieldFox’s OTA application enables OTA LTE and OTA 5G New Radio demodulation to give you insights on cell coverage. This information includes physical cell ID and control channel (often referred to as component carrier) measurements on any given frequency for all available cells. OTA measurements also help you address the common problem of identifying missing neighbours. FieldFox OTA provides a useful capability of displaying the strongest cell on different component carriers. This capability expedites the process of selecting the best frequencies for any given location to optimise inter-frequency handover. FieldFox can display cell measurements in table, bar graph, and strip chart formats, as shown in Figure 4.

Installing and maintaining cellular networks, satellite ground stations, radio networks, and other communications systems often requires in-field verification and adjustment of components, such as filters, duplexers, or antennas. FieldFox is designed to perform the measurements that field engineers need so that instrument capability for portability never has to be sacrificed.
| Tel: | +27 12 678 9200 |
| Email: | [email protected] |
| www: | www.concilium.co.za/test-measurement |
| Articles: | More information and articles about Concilium Technologies |
© Technews Publishing (Pty) Ltd | All Rights Reserved