Solar energy is a rapidly growing field. This energy is harvested using photovoltaic (PV) arrays and converted to electrical energy. A solar inverter is one of the most popular devices used to take that electrical energy and convert it to AC power, that can then power electronic devices or be fed back into the national power grid.
Maximum power point tracking (MPPT)
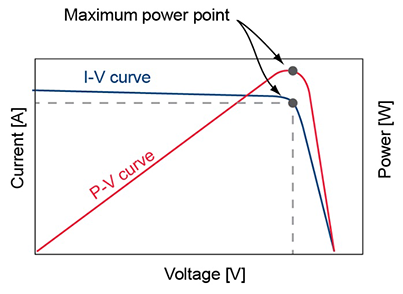
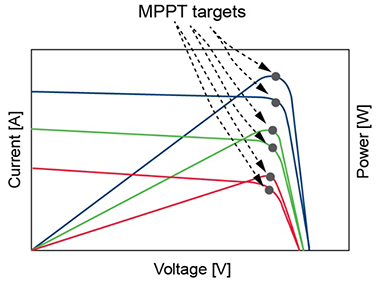
Maximum power point tracking (MPPT) is one of the most important tasks performed by a solar inverter. A solar inverter uses a maximum power point tracking algorithm that continuously runs to seek out the maximum power point of the photovoltaic (PV) array power characteristic that is powering its input. A PV array has an output characteristic known as an I-V curve. The output of the PV array is constantly changing due to factors such as cloud coverage and temperature. This means that the I-V curve that is being input into the solar inverter is also changing. The maximum power point changes as the PV array power characteristic changes, so the MPPT algorithm needs to adjust quickly to remain efficient.


In simple terms, the MPPT algorithm continuously moves the point at which the solar inverter is operating in very small increments. It will move the operating point of the inverter along the I-V curve. If the PV Array delivers more power when it moves in a certain direction, the algorithm will continue in that direction until the power delivered starts to decrease. It will then operate as closely as possible to this point until there is another change in the input power to indicate that the MPP has changed. This process runs continuously at the rate of every few seconds, to remain as efficient as possible.
MPPT efficiency
To maximise solar energy usage from the PV array, the solar inverter needs to be operating at the maximum power point as often as possible. MPPT efficiency is the metric that is used to determine this. In mathematical terms, MPPT efficiency is the amount of power harvested by the solar inverter, divided by the PV array’s maximum potential power generation.
Any potential power from the PV array that is not extracted by the solar inverter is wasted and cannot be recovered. A solar inverter with a low MPPT efficiency does not provide the best value to customers. It is important to note that MPPT efficiency is different from conversion efficiency, which is the ratio of AC power out of the inverter to DC power into the inverter. Conversion efficiency is another important metric for a solar inverter.
Simulating a PV array
Typically, when testing a solar inverter, using an actual PV array is unrealistic. PV arrays are large, and their output is determined by factors such as sunlight exposure and temperature. The most practical way to test a solar inverter is to use a PV simulator, which is a specialised power supply that mimics the output of a PV array. A PV simulator is fully programmable, so different PV curves can be programmed by the user.
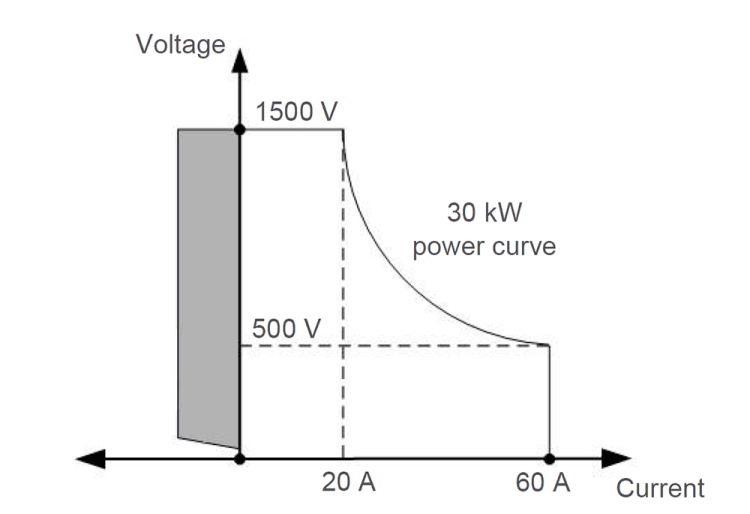
Keysight offers a family of 20 kW and 30 kW PV simulators that also function as auto-ranging DC power supplies. The PV8900 Series photovoltaic array simulators provide up to 2000 V and up to 60 A. With 20 kW in a small 3U-high size and 30 kW in 5U-high size, the PV8900 saves valuable rack space. If more power is needed, multiple units can be connected in parallel to create a supply with up to 600 kW of total output power. The built-in primary/secondary control enables programming of one unit to control the parallel-connected units. These PV simulators are specifically made to test devices that run on PV arrays at voltages up to 2000 V.

Solar Array Simulation (SAS) Control software
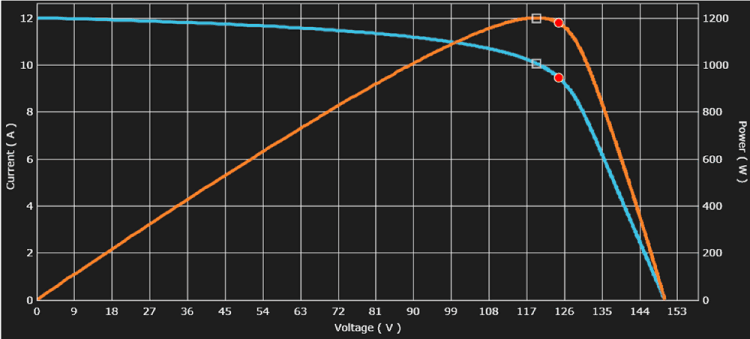
Keysight offers the DG8901A SAS Control software that provides easy access to the features of the PV8900. The software allows control of the power supply output, the ability to download custom I-V curves to the PV simulator, and an optional software upgrade to do automated MPPT efficiency testing. One very useful feature of the software is that it graphically illustrates, in real-time, the operating point of the PV inverter with respect to the true MPP illustrated in Figure 4.

In Figure 4, the blue curve is the I-V curve that the PV simulator is simulating, the orange curve is the power curve (also known as the P-V curve), the two small boxes represent the MPP, and the red dots are the operating point of the solar inverter. In Figure 4, the unit has not settled on the maximum power, and is still seeking it out.
In terms of MPPT efficiency testing, the Keysight DG8901A SAS control software can perform pre-compliance tests to the EN50530 standard. The EN50530 standard contains a set of tests that determine how efficiently a solar inverter tracks the MPP of both static and dynamic I-V curves. EN50530 is a widely accepted standard in the solar inverter industry. Having an automated program to perform the MPPT efficiency testing is necessary because these tests take long to complete. A full Static MPPT efficiency test can take up to six hours and a full dynamic MPPT efficiency test takes just over seven hours. The software also allows custom MPPT efficiency tests for test points that are not covered by the standard.
Using the SAS Control software
The SAS Control software allows four types of I-V curves to be generated: a Keysight specific curve, a custom curve generated by the user, a EN50530 curve, and a Sandia curve. To execute an EN50530 test (either static or dynamic), the PV simulator will simulate an EN50530 PV curve. The PV Simulator firmware uses a mathematical formula to set its output to simulate I-V curves based on parameters entered by the user. When selecting a static MPPT custom test, any curve type can be used. When selecting a custom dynamic test, only the Sandia curve or the EN50530 curve can be selected.
The software uses the built-in measurement system of the PV simulator to do the testing, with no external equipment being required. When the test is set up, a measurement period is specified. This is the rate at which the measurements for the test will be made. The lowest value that the measurement period can be set to is 15 ms. The instrument then measures the output, and these readings can be set to be logged every measurement period. Note that the instrument measures voltage and current simultaneously, and then calculates the DC power by multiplying these measurements.
The default setup time is 300 s (which is the maximum wait time specified in the standard), but this can be changed by the user based on the requirements of the solar inverter. The solar inverter is tested at the maximum, minimum, and nominal Vmp values to cover the entire operating range (Vmp being the voltage that the PV array is rated for). Different percentages of the Vmp are tested (from 5 to 100%) to cover a wide array of operating points with a total of 24 different MPPT efficiencies calculated.
Once all the data is collected, the static MPPT efficiency is calculated per the standard for all 24 test points, and written to the measurement report.
The dynamic MPPT efficiency test is more complicated than the static MPPT efficiency test since it needs to actively change the PV curves. The software does this using the built-in scaling feature. Scaling allows the curve to be set to a percentage of the maximum voltage and current. The software will then output the scaled curve without disabling the output. For dynamic MPPT efficiency, the I-V curves are required to change from an initial curve to a final curve over a specified time. Intermediate curves are calculated using scaling to meet the slope required. These curves are then output in sequence incrementally to change the curves to meet the timing requirement in a controlled way. The number of intermediate curves is dependent on the slope and the amount of time the curve needs to ramp.
Automated test reports
When all the testing is completed, the software generates two files. The first file is the test report that contains relevant information about the software, the instrument, and the test setup. The static MPPT efficiency test report provides all the calculated MPPT efficiencies and the average efficiency for the entire test. The dynamic MPPT efficiency report gives the efficiency of each step, the average efficiency for the entire test per the standard, and the weighted California (CEC) and European (EU) average efficiency. The second file is a collection of all the data logged used to calculate the efficiencies. All this data is collected as the test runs and is available upon conclusion of the test.
Conclusion
Keysight’s family of PV simulators provides solutions for automating the testing that will save time and effort. The user needs to set only the initial parameters and then set the test to run. The software will log all the measurements
| Tel: | +27 12 678 9200 |
| Email: | [email protected] |
| www: | www.concilium.co.za/test-measurement |
| Articles: | More information and articles about Concilium Technologies |

© Technews Publishing (Pty) Ltd | All Rights Reserved